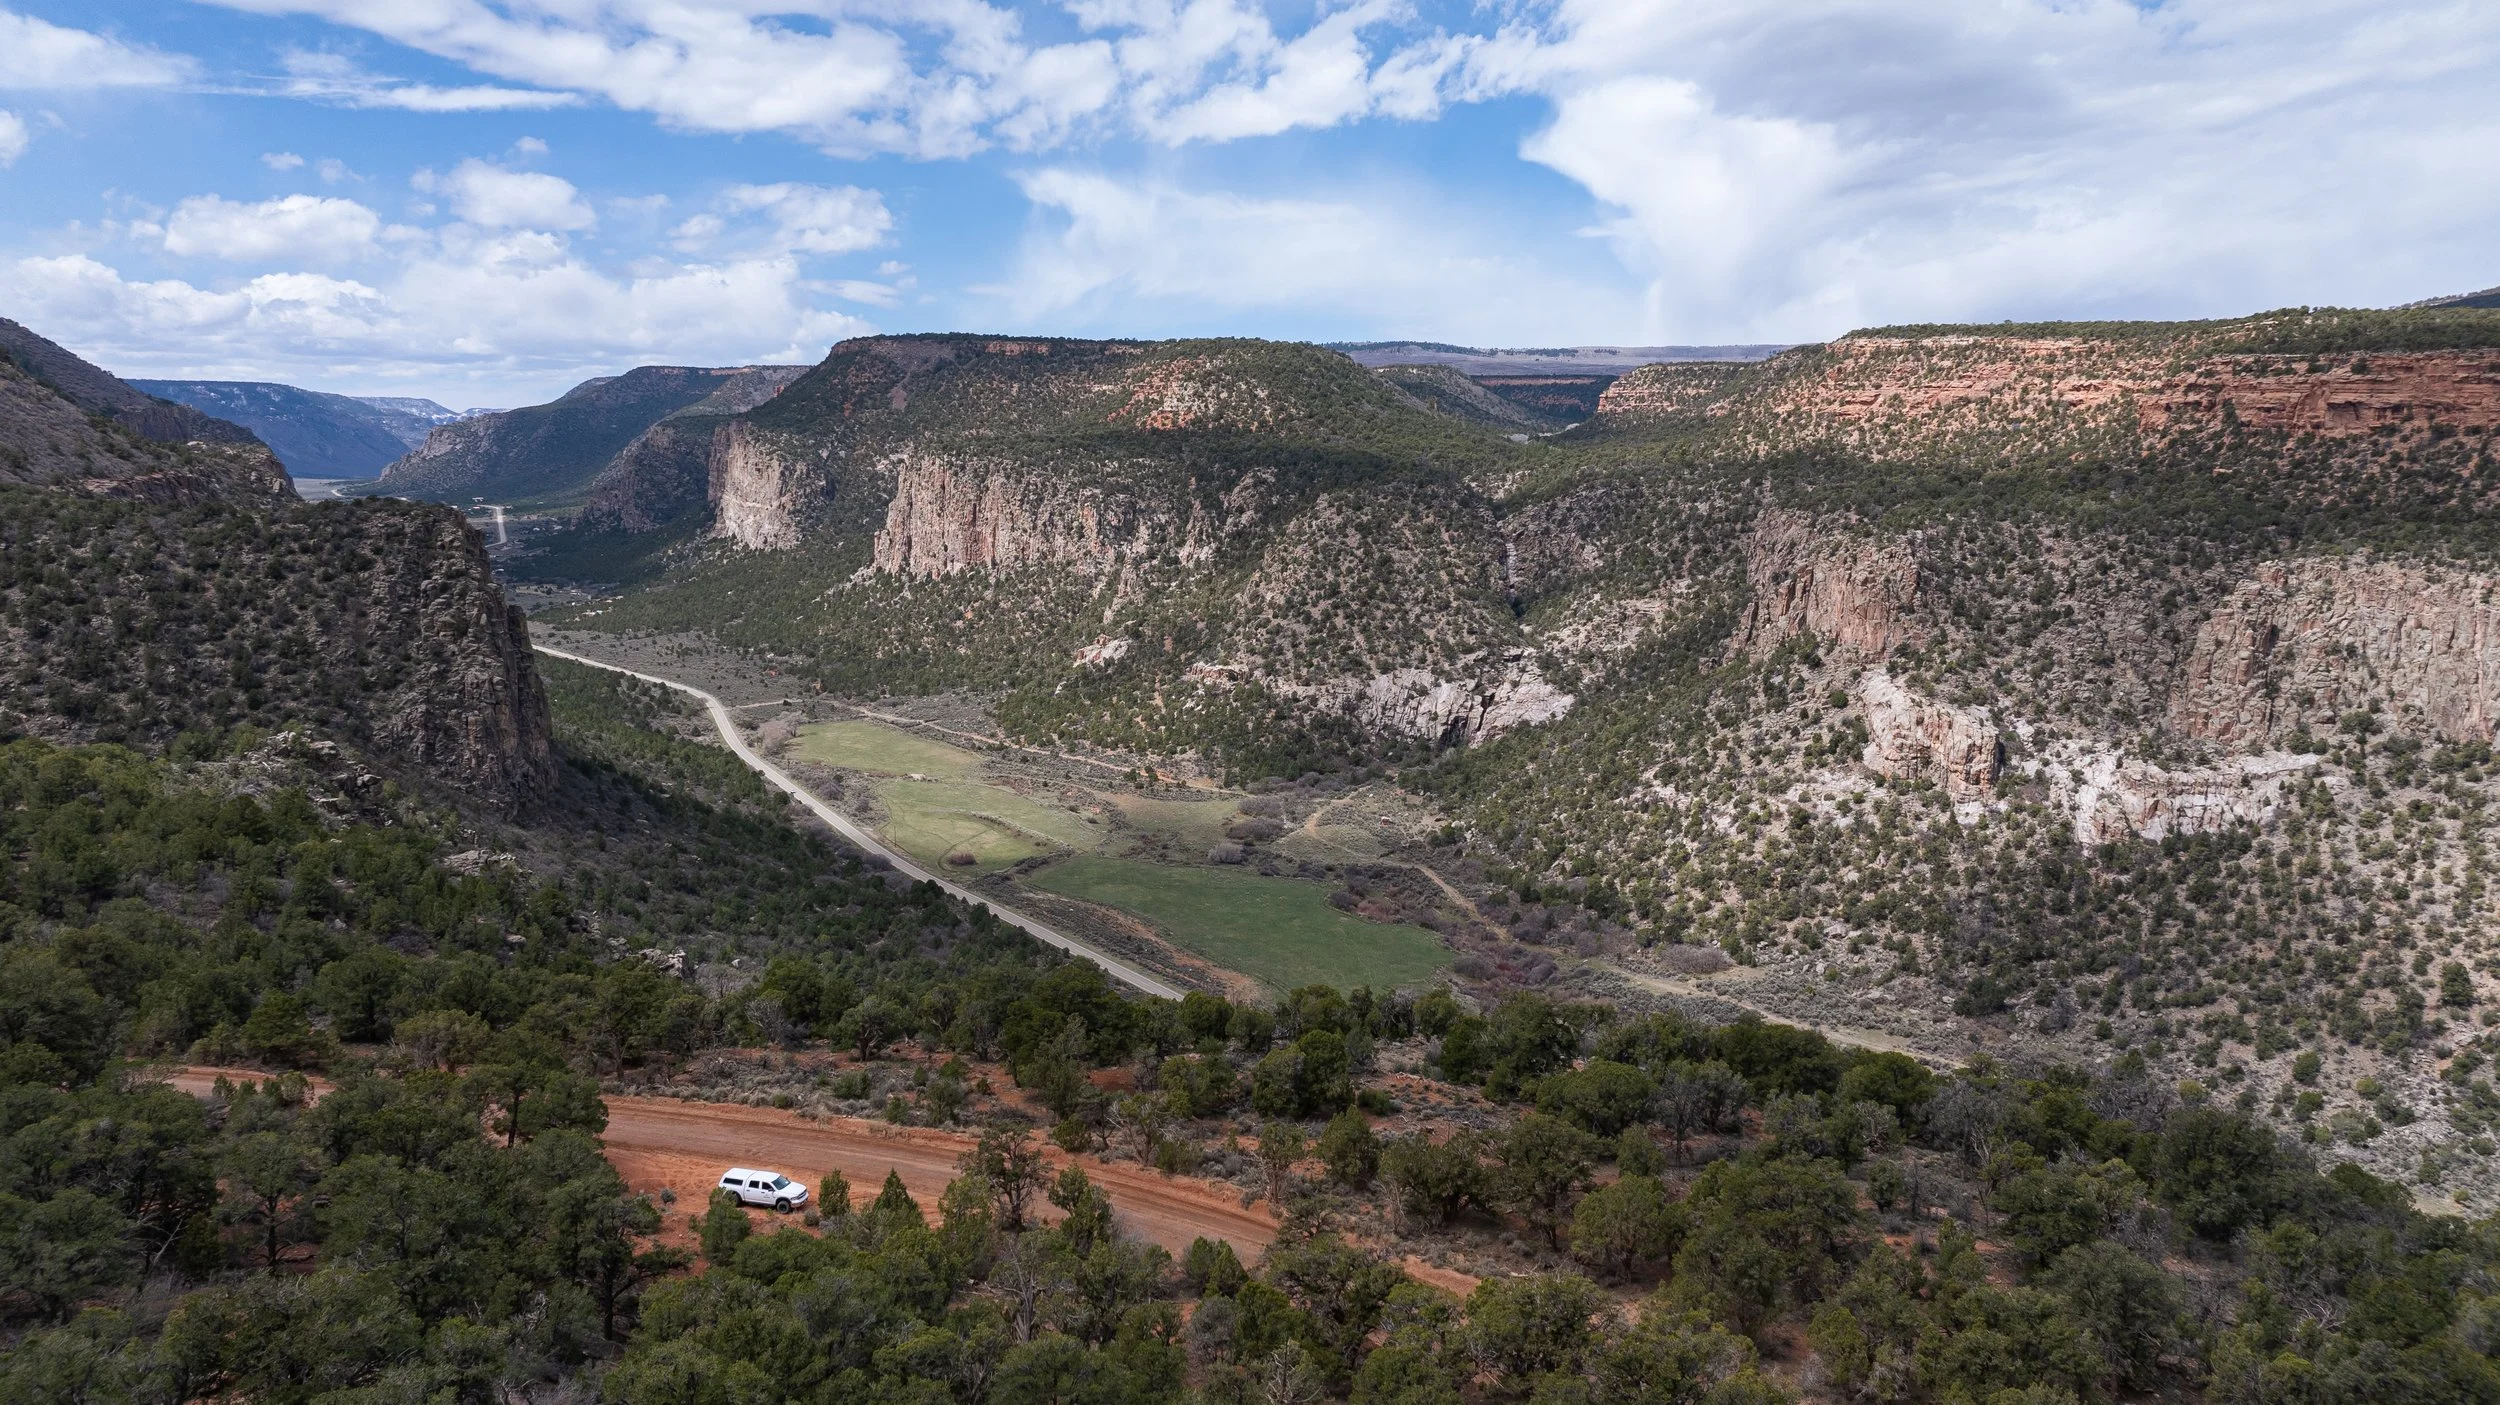
Colorado is home to almost 24 million acres of forest. The Forest Inventory and Analysis (FIA) program helps document how they change across time.

The science for FIA is unusual, or at least unlike what most people envision. There are no lab coats, there are no test tubes. The work is outdoors and intensely physical. Everyone who works this job has scars on their hands and arms from a bad fall or a thorny plant.

We work in tandem with nature. Wildlife sightings are almost daily; a thunderstorm can be life threatening.

Short hikes are a godsend, especially those that are on trail or don't force you to climb up a mountain.

Let’s dive into the methods.

It would be logistically impossible to measure every tree in Colorado. Instead, the FIA program randomly chooses "plots" across the state. Each plot is structured like this figure. We'll stay with this figure for a while.
The first thing to do when arriving to a plot is to find "plot center," which is the red dot with a 1 next to it on the figure.
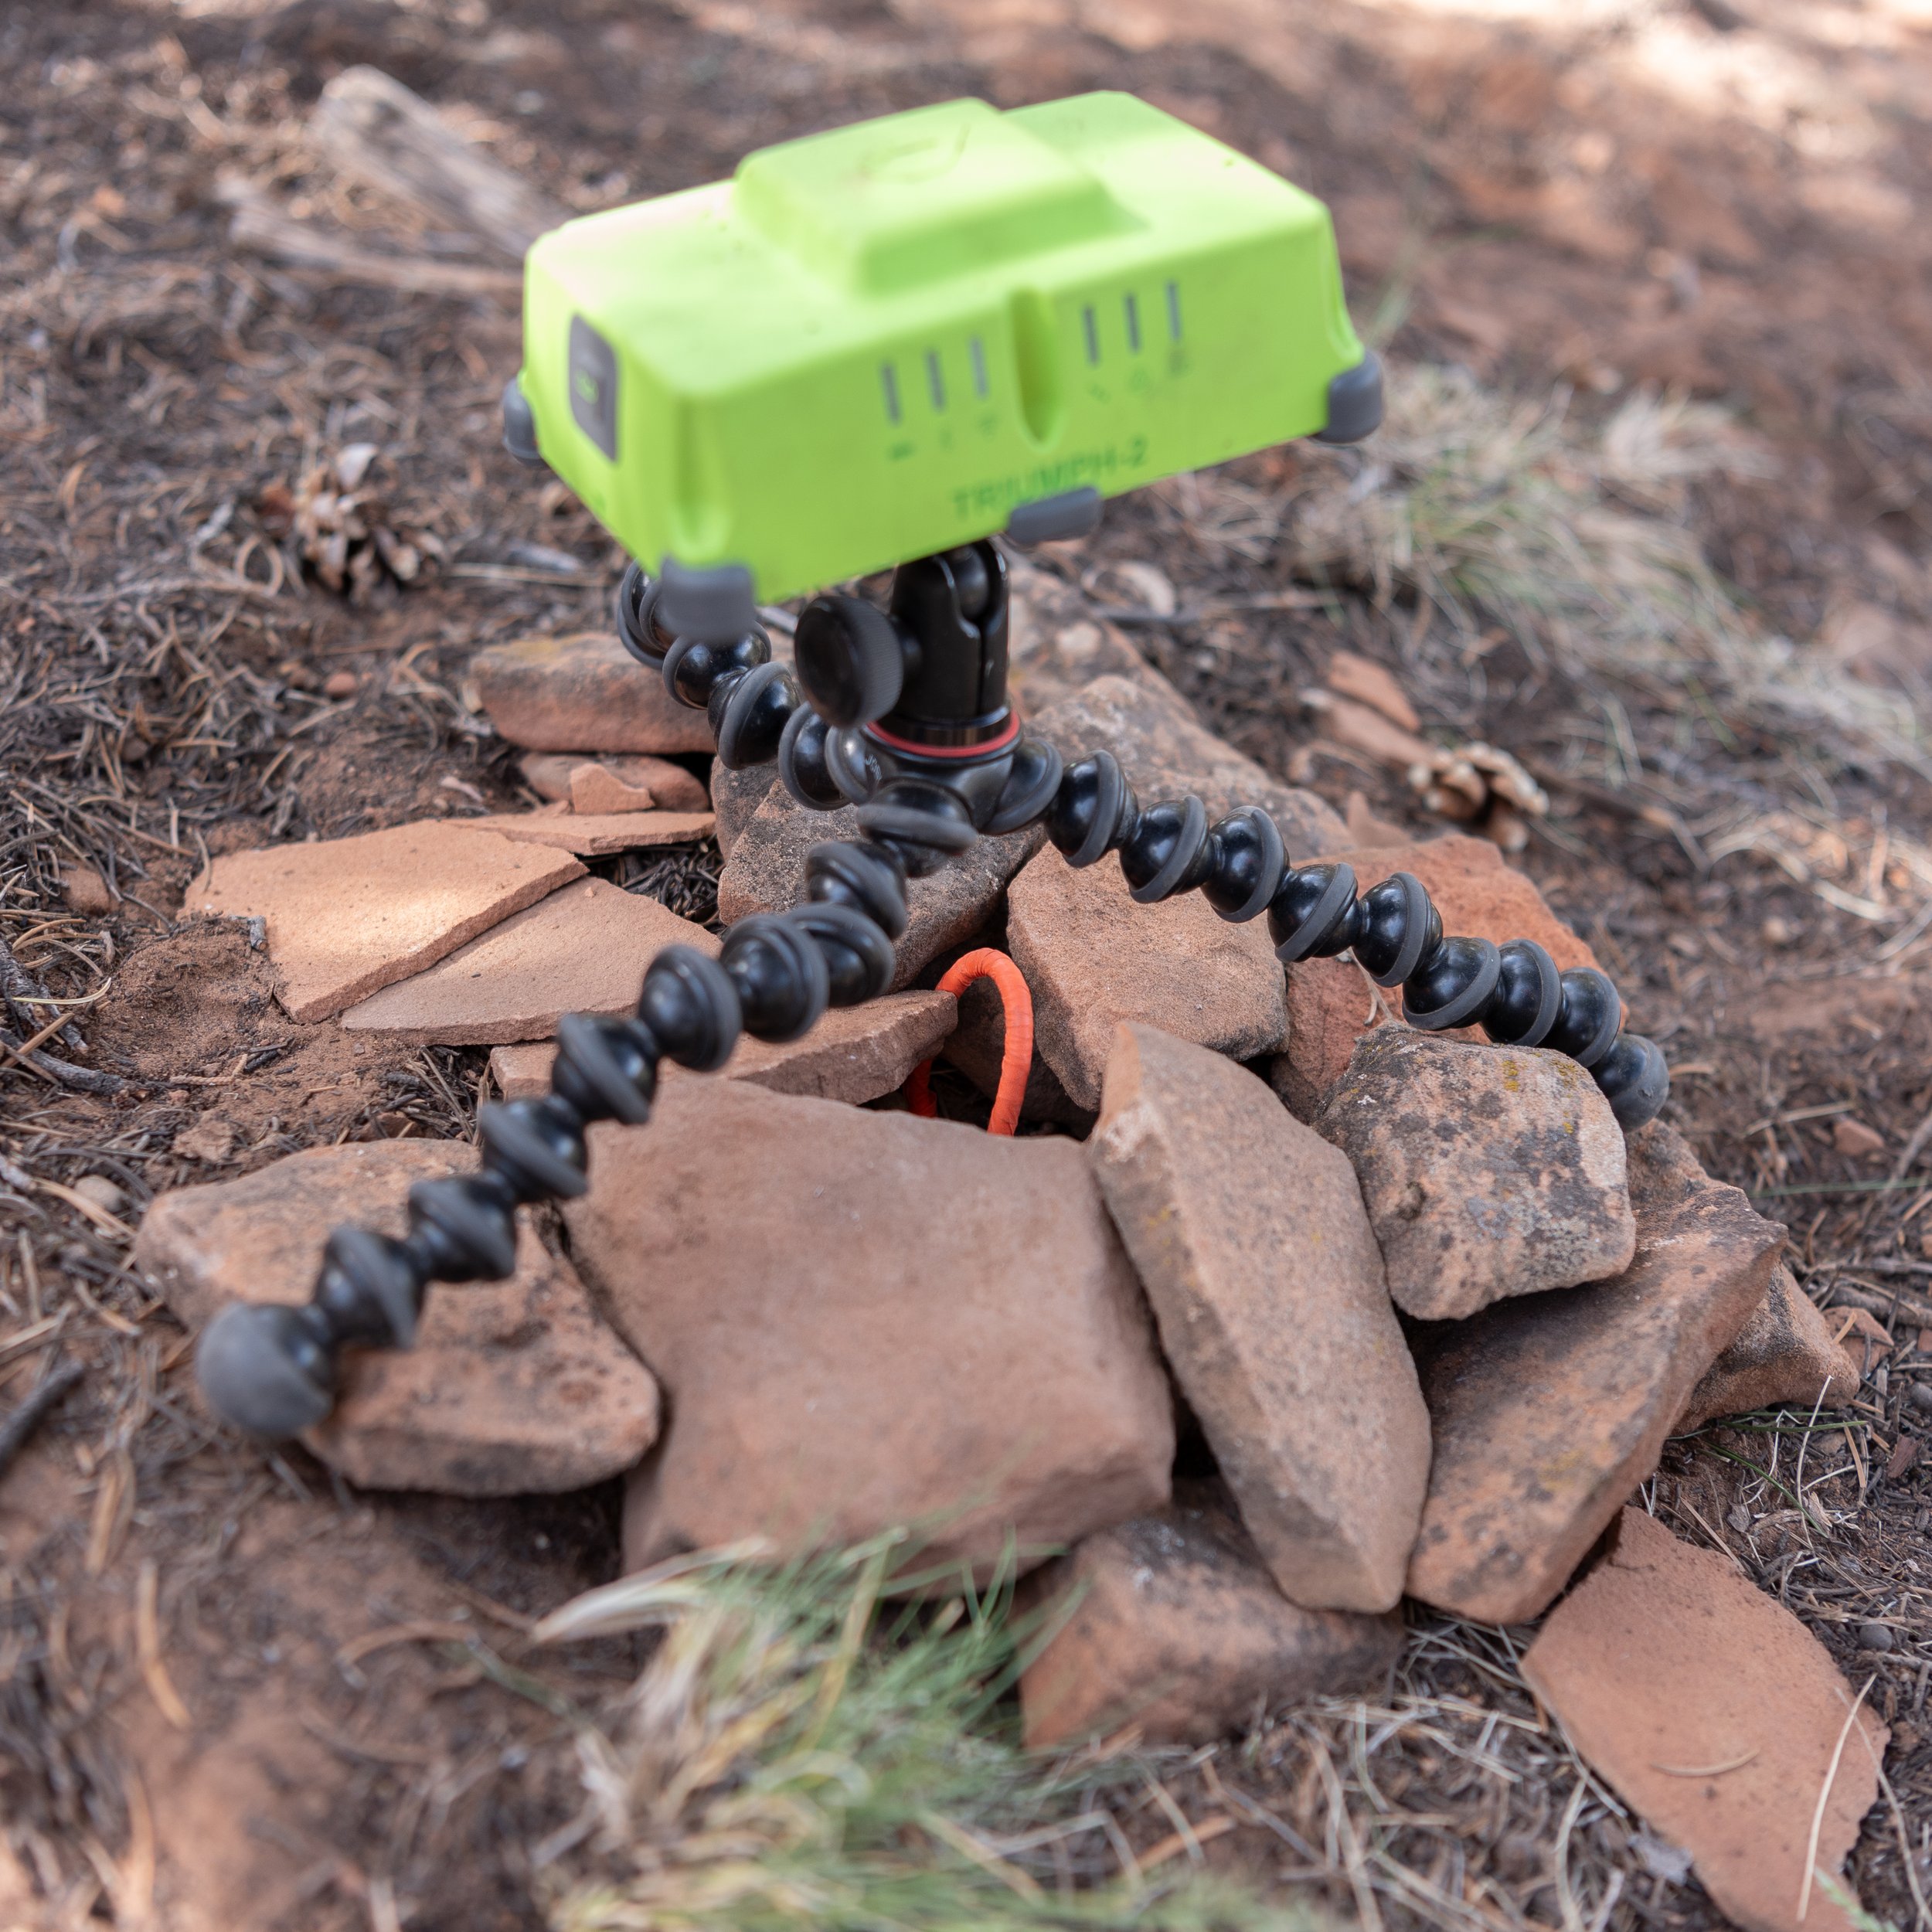
We measure each plot once every ten years. Because the program has existed in some form for almost 100 years, there are usually detailed directions and GPS coordinates to reach plot center, denoted by the stake wrapped in orange flagging. The green device on the tripod is a high-accuracy GPS, which will make it easier for future researchers to locate the plot.
Most of our work occurs within the light green circles in the figure, which are called "subplots." There are four subplots per plot. Each subplot has a 24-foot radius. We take the same measurements across all four subplots.

Compasses are critical for navigation between subplots. Subplot 1 sits at the center of the entire plot. The centers of subplots 2-4 are 120 feet away from subplot 1.

Trees are one of the main focuses on each subplot. Trees with diameters greater than or equal to 5 inches qualify and are included in the data. Some tree species are measured at breast height (4.5 feet from the base of the tree), while others are measured at their base. We use specialized tape to wrap the trees. It's important to wrap the tree as perpendicularly as possible so that the measurement isn't overestimated.

We mark the trees we measure with aluminum nails. This helps future researchers find the plots and keeps trees organized within the FIA database.

For each tree that is large enough on a subplot, the FIA program measures its length. It's tempting to say we measure a tree's height, but heights don't account for any leaning or bends along the trunk. Those are included in our measurements, so it's more accurate to call them "lengths."

For smaller trees, you can use a tape measure to reach the top of a tree, but the majority of trees are far too tall for that. In those cases, we use the good old Pythagorean theorem. Here, a coworker holds a "laser," which can measure the distance to a faraway object. Standing uphill from the tree in question, all you have to do is point the laser at the bole of the tree, then at its base, and then at its top. The laser will spit out a number for the height of the tree. It's surprisingly accurate.
The FIA program measures dead and live trees. For live trees, "crown cover," the total amount of the tree that is covered by live leaves or needles, is estimated visually. Crown cover is an indicator of tree health. For dead trees, we document the cause of death. Fire and insects are two of the most common mortality factors in Western Colorado. If a tree has suffered damages, we document those, too.

Understory vegetation is another variable we monitor on each subplot. This data is helpful for modeling the level of wildfire risk in the area. Vegetation is split into four different categories: grasses, forbs, shrubs, and trees. If a tree does not qualify by diameter for the inventory, it is counted as understory vegetation. We record plant species that cover at least 3% of the total area on a subplot.
Within each subplot, there is also a "microplot," denoted by the small dark grey circle with a 6.8 foot radius. Here, smaller trees are included in our measurements to account for new growth in the forest.

There is a stake that sits at the center of the microplot, wrapped in blue and white striped flagging. On each subplot, microplot center is 12 feet away from subplot center at 90 degrees. Having two stakes is also helpful for finding each subplot.

Sometimes, we take a small sample from the tree using an increment borer. We can track a tree's age and growth patterns by counting the rings measuring the space in between them. The more space, the faster the growth. Increment borers don’t significantly damage trees.
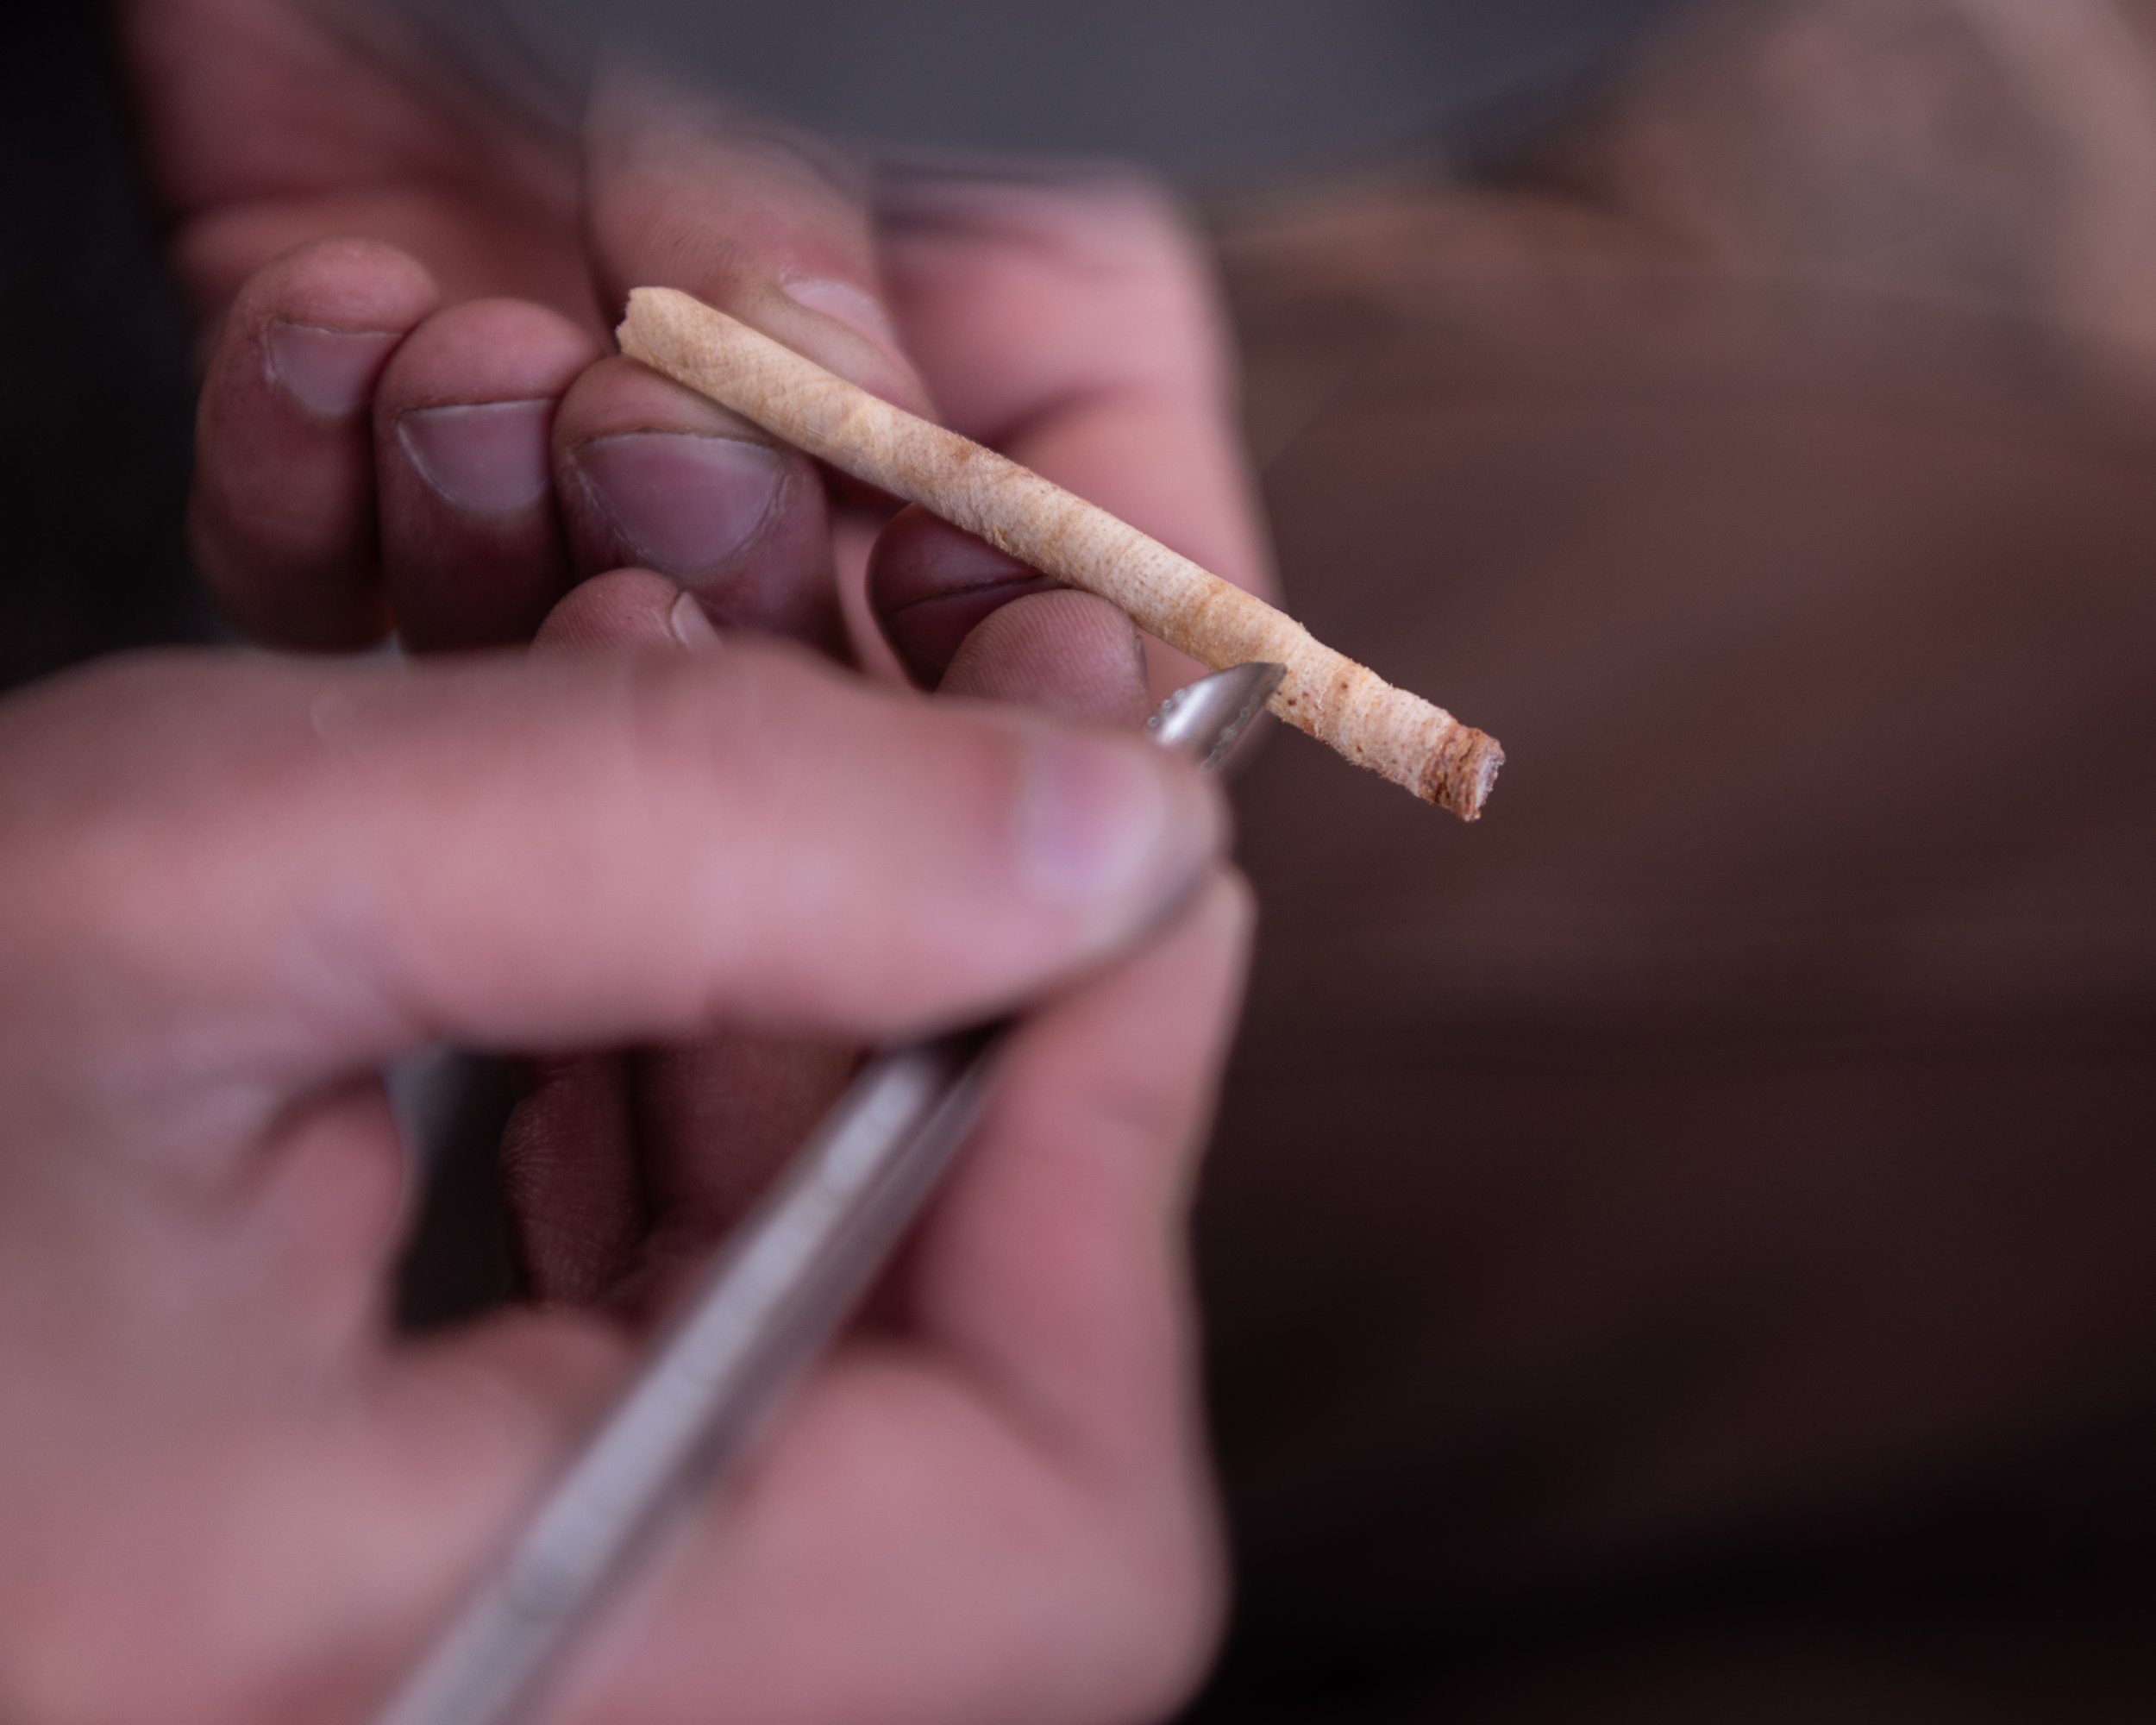
Some tree cores are harder to count than others. This Utah Juniper tree has particularly tight rings.

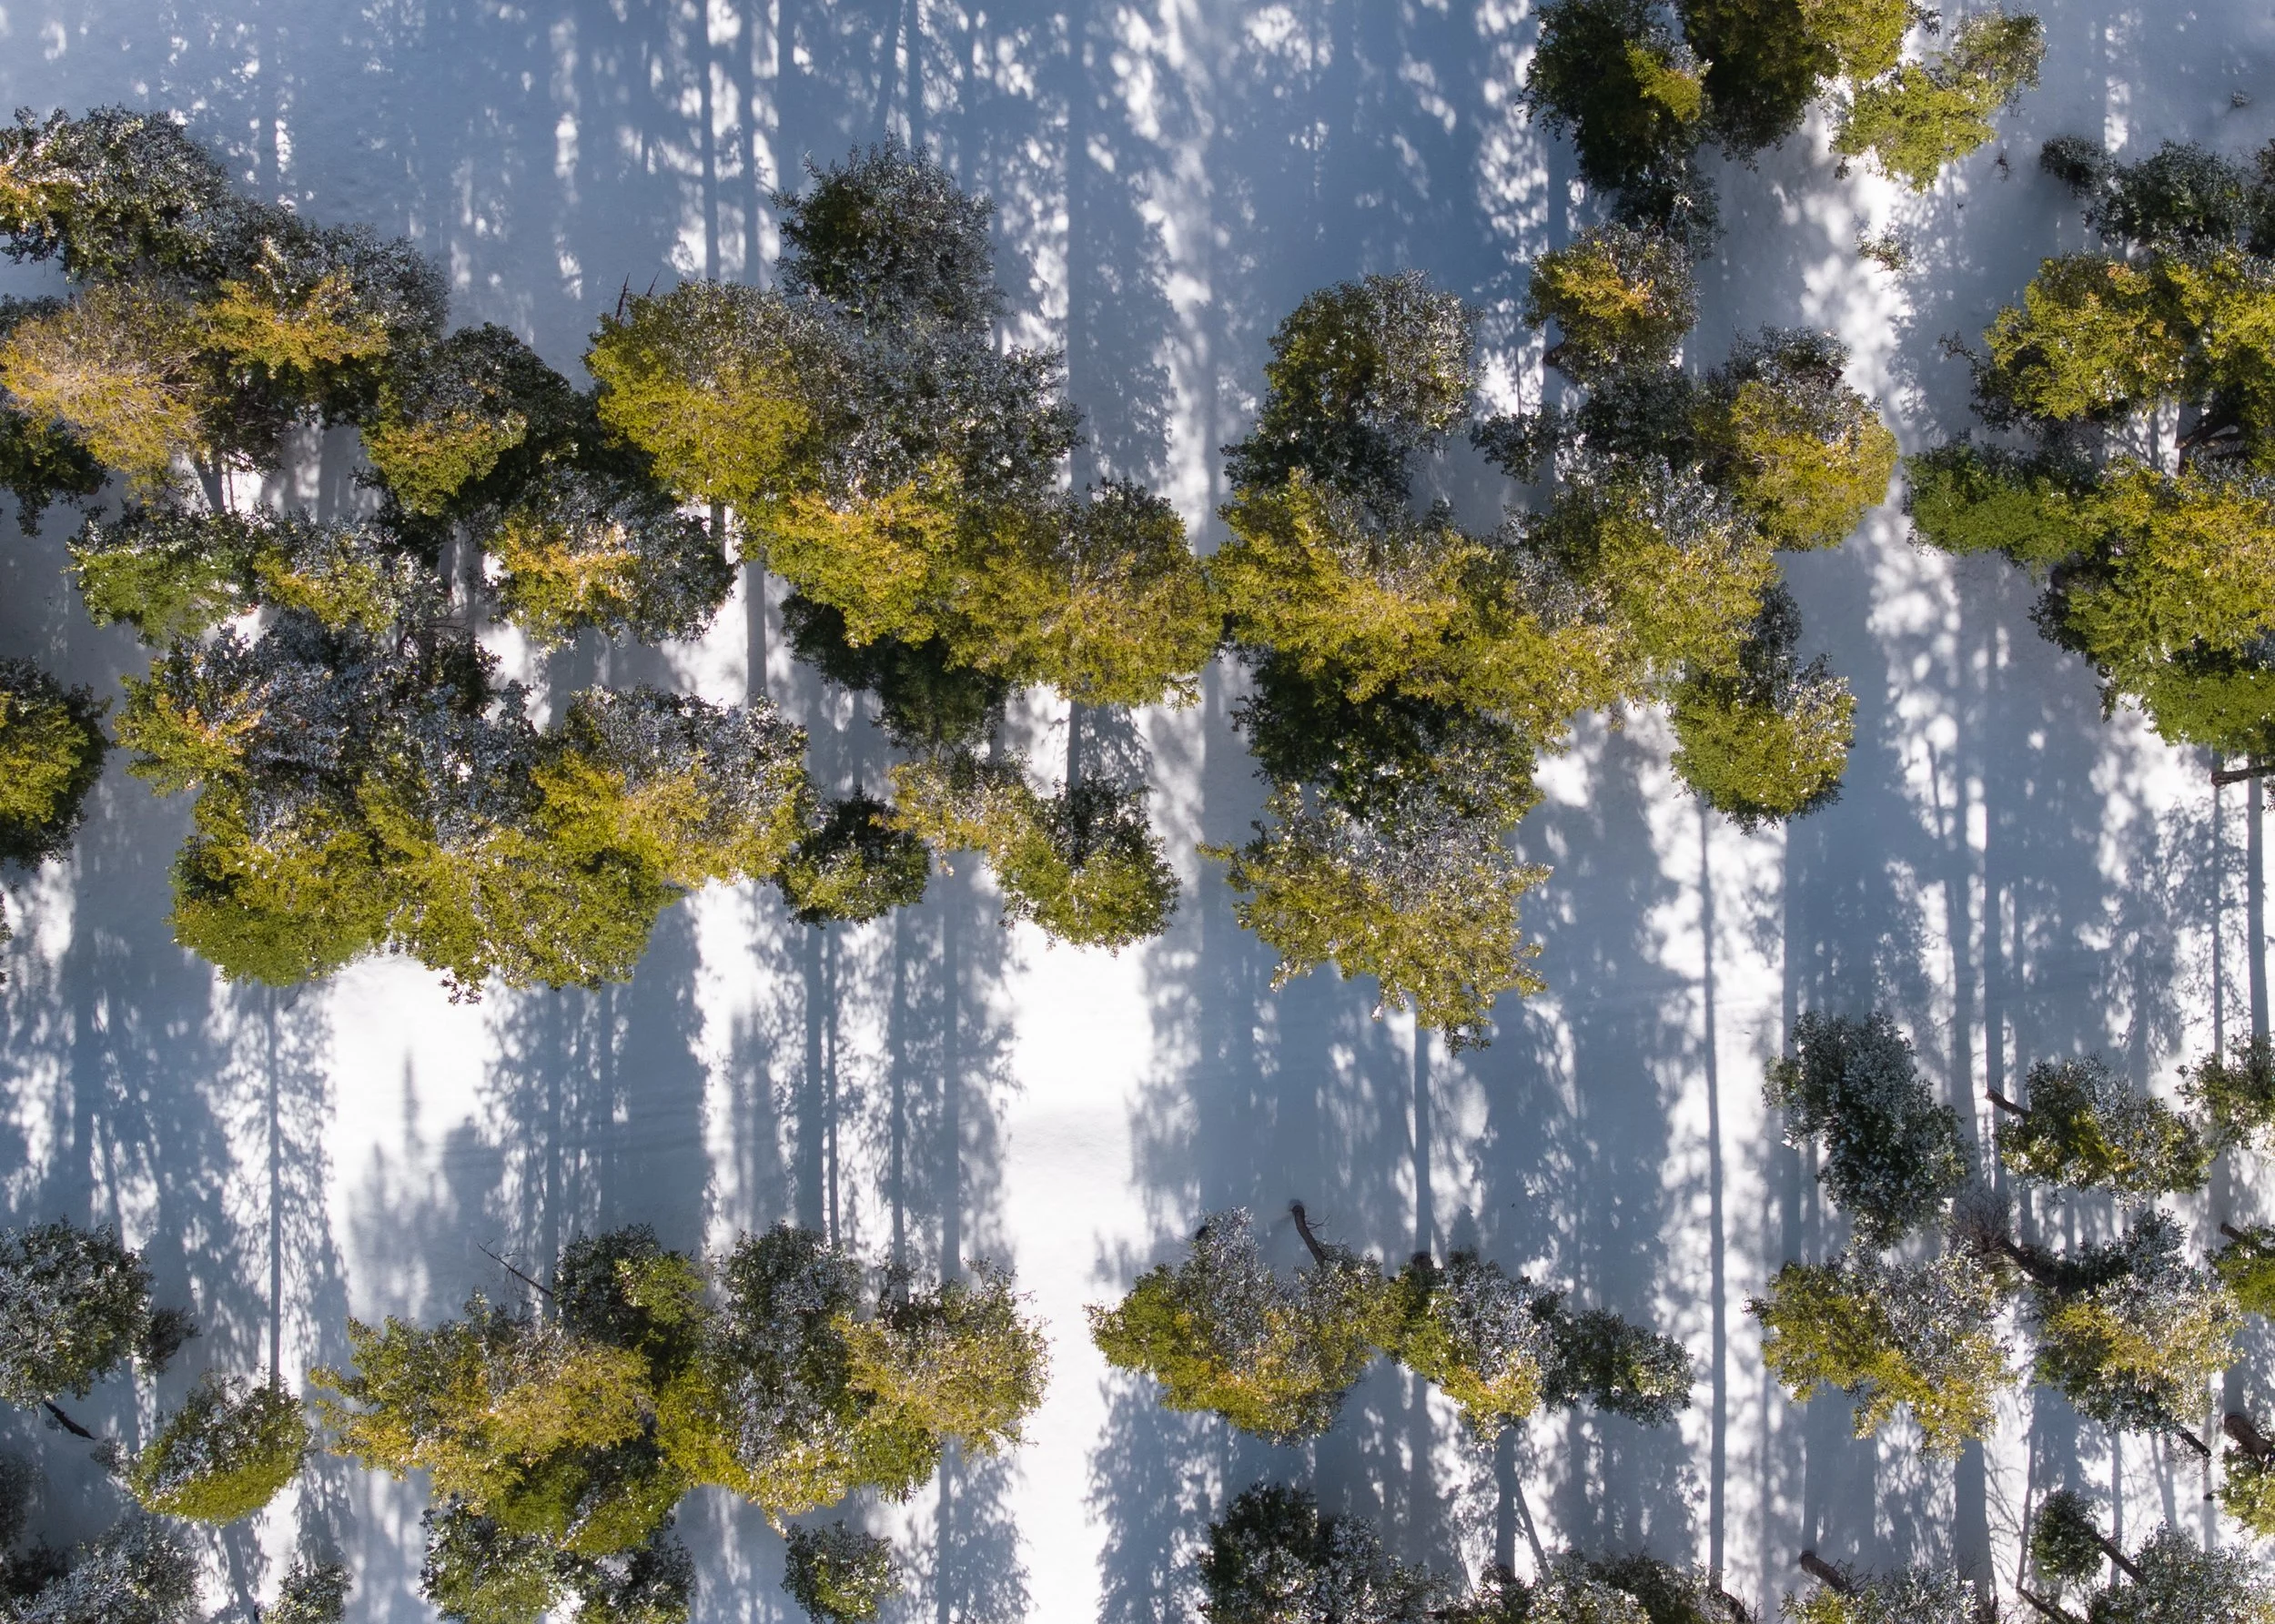
Because so much of our work is off the grid, camping is the easiest way to stay close to plots. I'd estimate that I spent about 60 nights sleeping in a tent in 2024 for work.

The time outside is nice for photography. I took this image right outside of my tent after work.

FIA is a national program. The data is open source. Scientists across the country use this research to study a myriad of topics, from shifting ecological ranges of edible plants to how drought affects tree growth and mortality. Especially because the FIA program spans whole country, this data has regional and national policy inroads.

For example, FIA data informed the Colorado's Forest Resources 2004 - 2013 report, which evaluated current issues our forests face, including damage from pine and spruce beetles and the connection between drought and the sudden decline of quaking aspen trees. Click on the image on the right to be taken to the full report.

Click on this image to be taken to the Colorado State Forest Service's website for more information.